Introduction
I’ll keep this short and sweet, I think I covered most bases in the video. As I said I’m not currently looking to open source or release this in the wild but if other creators are interested you can contact me on the contact page and perhaps we can work together on a solution for you. Thanks again to Modmen in our Discord for the video idea!
DAC Test Methodology
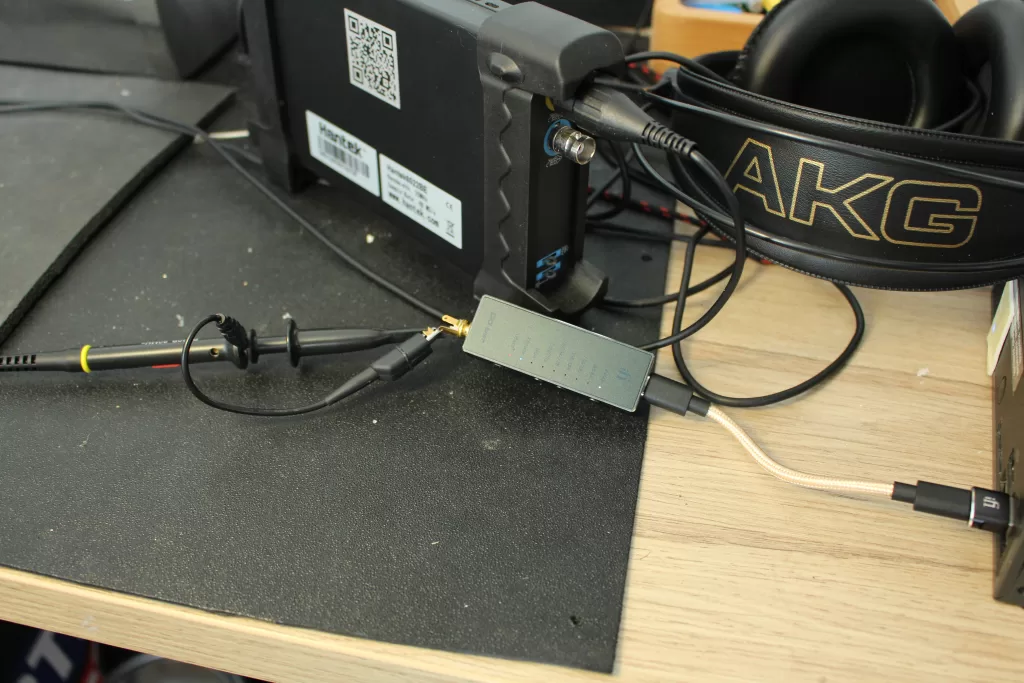
It’s based on a simple audio sweep of the audio range from 20 to 20000Hz, generally known as the human range of hearing. We record the output of the DAC through the sample and then plot this data on a chart that is easy to visualise how the DAC has performed. Clear indicators like the thinner the graphs line shows the quality and consistency of the sound, or a wide line shows inconsistency or distortion. Any dips or sharp peaks show where additional EQs have been set or may uncover issues or shortcomings in the output.
Parts
- Hantek 6022BE Oscillascope
- Any Linux PC (Raspberry PI I’m sure could run it)
- My simple scripts/software
- DAC or AMP to test!

Conclusion
In the near future, I will open the forum that will host all the data so that my viewers can have the chance to compare charts and hopefully make an informed decision when thinking of purchasing a new or used DAC. I will be sure to link it here when it’s completed!